What beginners should look out for in a stock

The dream of the stock market is often painted in strokes of “get rich quick” schemes and high-frequency trading floors. However, for the successful long-term investor, the stock market isn’t a casino; it’s a collection of businesses. When you buy a share of a company, you aren’t just buying a ticker symbol like AAPL or TSLA—you are becoming a partial owner of a living, breathing corporation.
The biggest mistake beginners make is buying a stock because “it’s going up” or because a friend mentioned it in a group chat. In 2026, where information moves at the speed of an algorithm, the real “secret” to investing is Fundamental Analysis. This is the process of looking at the health of the company itself to determine its value.
In this exhaustive guide, we will break down exactly what you should observe in a stock before you click the “buy” button. We’ll cover the numbers, the narrative, and the psychological traps to avoid.
Understanding the Business Model: Do You Know How They Make Money?

The legendary investor Peter Lynch once said, “Never invest in any idea you can’t illustrate with a crayon.” Before looking at a single spreadsheet, you must understand the company’s “Story.”
If you can’t explain to a ten-year-old how a company generates its revenue, you probably shouldn’t own it. For beginners, it is often best to start with “Circle of Competence” stocks—companies whose products you use and understand.
Key questions to ask:
-
What do they sell? Is it a physical product, a software subscription (SaaS), or a service?
-
Who is the customer? Is it “Business-to-Consumer” (B2C) like Nike, or “Business-to-Business” (B2B) like Salesforce?
-
Is it a “Need” or a “Want”? In a recession, people will keep buying toothpaste and paying their electric bills, but they might skip the luxury handbag.
Revenue and Profit Growth: Analyzing the Top and Bottom Line
Once you understand the business, you need to look at the numbers. In every financial report, there are two primary figures that tell the story of a company’s growth: Revenue (Top Line) and Net Income (Bottom Line).
Revenue (The Top Line)
Revenue is the total amount of money a company brings in from selling its products or services. A healthy company should show consistent revenue growth year over year. If revenue is shrinking, it might mean the company is losing its market share or the industry is dying.
Net Income (The Bottom Line)
Net income is what is left over after all the bills (salaries, taxes, rent, materials) are paid. This is the actual profit. Some young “growth” companies may have high revenue but no profit because they are reinvesting everything to grow faster. As a beginner, look for companies that are either already profitable or have a very clear path to becoming profitable soon.
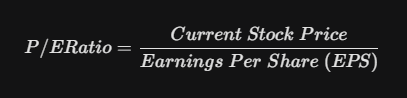
The P/E Ratio: Is the Stock Price “Expensive” or “Cheap”?
One of the most common mistakes beginners make is thinking a stock is “cheap” just because the price is $10. In reality, a $1,000 stock can be “cheaper” than a $10 stock if you look at the Price-to-Earnings (P/E) Ratio.
The P/E ratio tells you how much investors are willing to pay for every $1 of profit the company makes.
How to use the P/E Ratio:
-
High P/E (e.g., 50+): Investors expect massive growth in the future. This is common in tech and AI sectors. However, if the company fails to grow as expected, the stock price could crash.
-
Low P/E (e.g., 10-15): This often indicates a “Value” stock. The company might be mature and stable, or it might be “cheap” because the market doesn’t see much future potential.
-
Benchmark: Always compare a stock’s P/E to its competitors in the same industry. A software company will naturally have a higher P/E than a utility company.
Dividend Yield and Payout Ratio: Getting Paid to Wait
If you want your portfolio to generate passive income, you should look for Dividends. A dividend is a portion of a company’s profit that is sent directly to your brokerage account, usually every three months.
Dividend Yield
The yield is the annual dividend payment divided by the stock price, expressed as a percentage. If a stock costs $100 and pays $4 a year in dividends, the yield is 4%.
The Payout Ratio: The “Safety Check”
A high yield is great, but is it sustainable? The Payout Ratio tells you what percentage of the company’s profit is being used to pay dividends.
-
Below 50%: Very safe. The company has plenty of money left over to grow.
-
Above 80%: Potentially dangerous. The company is using almost all its profit for dividends, leaving no room for error or growth. This is a common sign of a “Dividend Trap.”
Debt Levels and the Balance Sheet: The “Health” Checkup

In 2026, interest rates have stabilized but remain a significant factor for corporate health. A company with too much debt is “fragile.” If the economy slows down, the debt interest payments can bankrupt a company.
The Debt-to-Equity (D/E) Ratio
This metric compares a company’s total debt to the amount of money shareholders have invested.
-
Low D/E (Below 1.0): The company is conservatively managed and uses its own money to grow.
-
High D/E (Above 2.0): The company is heavily “leveraged.” This can amplify gains during good times but lead to total ruin during bad times.
For a beginner, sticking to companies with “fortress balance sheets” (lots of cash and very little debt) is the best way to avoid a total loss of capital.
The “Economic Moat”: Does the Company Have a Competitive Advantage?
Warren Buffett popularized the concept of the Moat. In medieval times, a moat protected a castle from invaders. In the stock market, a moat protects a company’s profits from competitors.
Types of Moats to Observe:
-
Brand Power: Think of Apple or Coca-Cola. People are willing to pay more for the brand name, which gives the company “pricing power.”
-
Network Effect: Think of Meta (Facebook/Instagram) or Visa. The more people use the service, the more valuable it becomes to every other user.
-
Cost Advantage: Think of Walmart or Amazon. They are so large that they can negotiate lower prices than anyone else, making it impossible for small competitors to survive.
-
High Switching Costs: Think of enterprise software like Microsoft Office. Once a whole company is trained on it, it’s too expensive and difficult to switch to something else.
Management Quality: Who is Steering the Ship?
When you buy a stock, you are hiring the CEO and the board of directors to manage your money. Even the best business model can be ruined by poor management.
How to research management:
-
Read the “Letter to Shareholders”: Found in the annual report (Form 10-K). Is the CEO honest about mistakes, or do they blame “the economy” for everything?
-
Look at “Insider Buying”: If the CEO and directors are buying their own company’s stock with their own money, it shows they have confidence in the future. If they are selling everything, you should be worried.
-
Tenure: Has the leadership been there for a long time, or is there a “revolving door” of CEOs? Consistency is usually a good sign.
Market Capitalization: Does the Size Fit Your Risk Profile?
Market Cap is the total dollar value of all a company’s shares. It tells you how “big” the company is.
The Three General Categories:
-
Large-Cap ($10 Billion+): These are the “Blue Chip” companies. They are stable, pay dividends, and are unlikely to go bankrupt. However, they grow more slowly.
-
Mid-Cap ($2 Billion – $10 Billion): These are companies in their prime. They have more growth potential than Large-Caps but are more volatile.
-
Small-Cap ($300 Million – $2 Billion): These are the “Aggressive” plays. They can double or triple in value quickly, but they can also go to zero if they fail to secure funding or lose a major customer.
Industry Trends: Is the Wind at Their Back or in Their Face?
A great company in a dying industry is a bad investment. You want to invest in companies that are part of a growing secular trend.
Trends to watch in 2026:
-
The AI Revolution: Beyond just the hype, which companies are actually becoming more efficient because of AI?
-
Renewable Energy: The global shift away from fossil fuels.
-
Cybersecurity: As the world becomes more digital, the cost of data breaches rises, making security a “must-have” for every business.
-
Healthcare and Aging Populations: With “Baby Boomers” entering their later years, the demand for medical technology and pharmaceuticals is steadily increasing.
The Price Chart: Avoiding the “Catching a Falling Knife” Trap

While fundamental analysis tells you what to buy, looking at a basic price chart can help you decide when to buy.
The 200-Day Moving Average
This is the average price of the stock over the last 200 days.
-
If the stock is trading above the 200-day average, it is in an “Uptrend.”
-
If it is trading below the average, it is in a “Downtrend.”
As a beginner, it is usually safer to buy stocks that are in an uptrend. Buying a stock that is crashing (even if it seems “cheap”) is like “catching a falling knife”—you might get hurt before it hits the bottom.
The “Red Flags”: When to Walk Away
Sometimes, the best investment is the one you don’t make. Watch out for these warning signs:
-
Excessive Stock Dilution: If the company is constantly issuing new shares to raise money, your “piece of the pie” is getting smaller.
-
Negative Cash Flow: If a company makes a “profit” on paper but is actually burning through its cash reserves, it is at risk of bankruptcy.
-
Legal or Regulatory Trouble: Ongoing lawsuits or government investigations can haunt a stock price for years.
-
The “Hype” Factor: If you see the stock being promoted by influencers or on Reddit with “rocket ship” emojis but no mention of profits, stay away.
Putting It All Together: Your Beginner’s Checklist
Before you make your first trade, run the stock through this checklist:
-
[ ] Do I understand the business model?
-
[ ] Are Revenue and Profits growing?
-
[ ] Is the P/E Ratio reasonable for its industry?
-
[ ] Does it have a “Moat” (Competitive Advantage)?
-
[ ] Is the Debt-to-Equity ratio below 1.5?
-
[ ] Do I have a long-term mindset (3-5 years minimum)?
The Journey of a Thousand Miles
Investing is a marathon, not a sprint. You don’t need to be right every time; you just need to avoid the catastrophic mistakes that wipe out your capital. By focusing on quality, valuation, and business fundamentals, you are moving from a “gambler” to an “investor.”
The stock market is the greatest wealth-building tool in history, but it requires patience and discipline. Start small, keep learning, and remember: the best time to plant a tree was 20 years ago; the second best time is today.