What Happens During a Trading Day?
To the uninitiated, the stock market looks like a chaotic blur of flashing green and red numbers, frantic news tickers, and complex charts. However, behind that perceived chaos is a highly structured, rhythmic cycle that repeats every single day. For the successful investor, the stock market is not just a place to buy and sell; it is a living organism with a specific daily routine.
Understanding what happens during a trading day—from the early whispers of the pre-market to the final settlement after the closing bell—is crucial for anyone looking to build long-term wealth. Whether you are a “buy and hold” investor or someone looking to understand intraday volatility, this guide will walk you through the anatomy of a trading day in the United States markets.
The Pre-Market Session: Where the “Smart Money” Stirs
Time: 4:00 AM – 9:30 AM Eastern Time (ET)
While the famous “Opening Bell” doesn’t ring until 9:30 AM, the market actually begins to breathe much earlier. This period is known as the Pre-Market Session.
During these hours, trading volume is significantly lower than during regular hours. Because there are fewer participants, the “spread” (the difference between what someone is willing to pay and what someone is willing to sell for) is often wider. This makes the pre-market a volatile and risky environment for laypeople.
Why the Pre-Market Matters
Most of the world’s major news happens when the U.S. market is closed. Overseas economic data from Europe and Asia, overnight political developments, and early morning earnings reports all “price in” during this session. If a major tech giant releases a disappointing earnings report at 7:30 AM, you will see the stock price plummet in the pre-market long before the general public can trade it on the major exchanges.
Key Takeaway: The pre-market sets the “tone” for the day. It tells us whether the market will “Gap Up” (open higher than yesterday’s close) or “Gap Down” (open lower).
The Opening Bell: The Initial Burst of Volatility
Time: 9:30 AM – 10:30 AM ET
At exactly 9:30 AM, the New York Stock Exchange (NYSE) and the NASDAQ officially open for regular trading. This is often the most intense hour of the day.
Price Discovery and Order Imbalance
During the first few minutes, the market undergoes a process called Price Discovery. All the orders that piled up overnight and during the pre-market are executed at once. This creates massive “order flow,” and the market tries to find a fair price where buyers and sellers meet.
For beginners, the first 30 minutes are often a “danger zone.” Prices can swing wildly in both directions as institutional algorithms and high-frequency traders (HFTs) fight for position. Professional traders often wait for this initial “noise” to settle before making their first move.
The Morning Session: The Trend Establishment
Time: 10:30 AM – 11:30 AM ET
By 10:30 AM, the initial “opening craze” begins to fade. The high-volume spikes subside, and the market starts to establish a Trend.
During this hour, institutional investors (pension funds, mutual funds, and hedge funds) begin executing their larger positions. If the market is going to be “Bullish” (upward) or “Bearish” (downward) for the day, the direction is usually confirmed during this window. This is often considered the “sweet spot” for active traders because the volatility is high enough to make profit, but the direction is clearer than at the open.
The “Lunch Lull”: When the Market Takes a Breath
Time: 11:30 AM – 1:30 PM ET
As traders in New York head out for lunch, trading volume typically drops. This period is known as the Lunch Lull.
Characteristics of Mid-Day Trading:
-
Sideways Movement: Without massive institutional buying or selling, prices often drift sideways in a narrow range.
-
Low Liquidity: Because fewer people are trading, it can be harder to enter or exit large positions without affecting the price.
-
False Breakouts: Beware of sudden price movements during this time; they often lack the “volume” to sustain themselves and may quickly reverse.
For the long-term investor, the lunch hour is a quiet time. However, for the market as a whole, this is often the “digestion period” where investors analyze the morning’s news and prepare for the afternoon session.
The Afternoon Session: European Close and Sentiment Shifts

Time: 1:30 PM – 3:00 PM ET
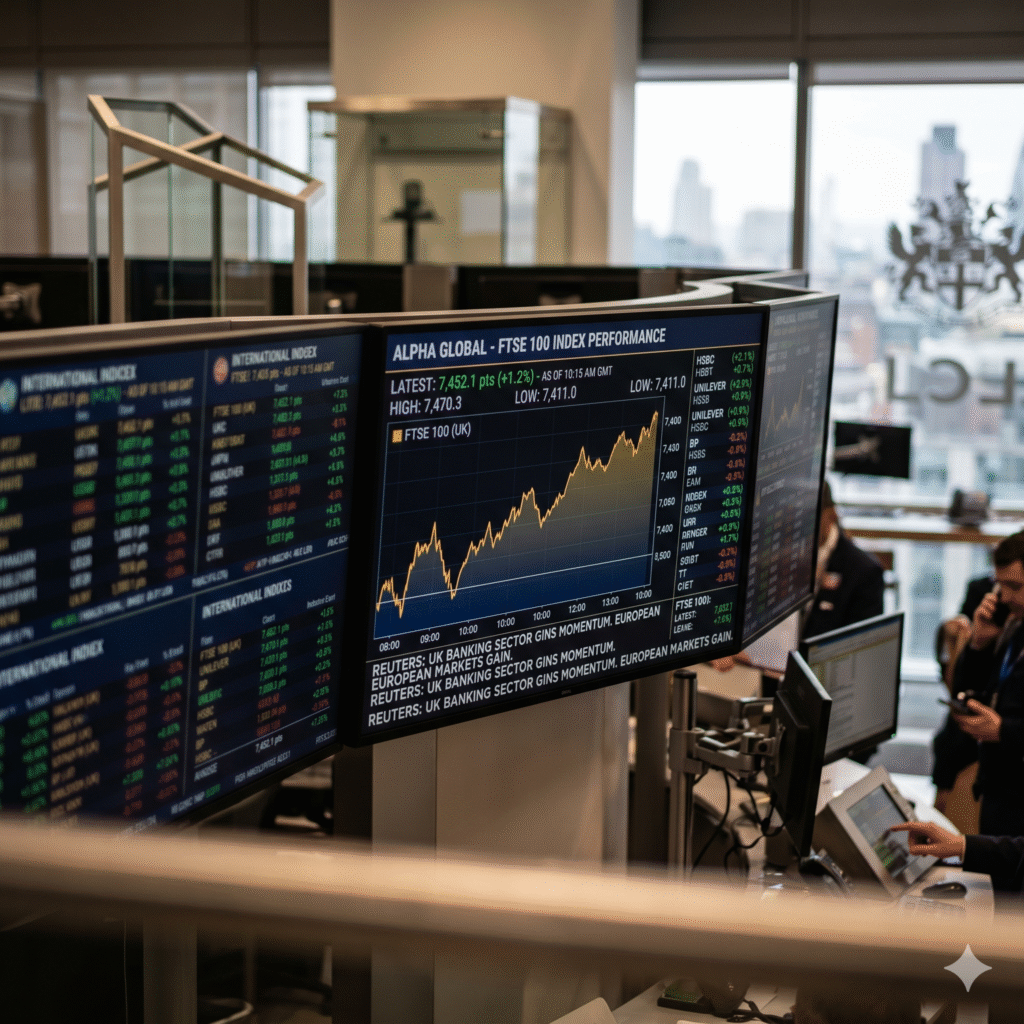
As the afternoon begins, the market “wakes up” again. A major catalyst during this time is the European Market Close (usually around 11:30 AM to 12:30 PM ET depending on the time of year). When European traders finish their day, they often rebalance their U.S. holdings, which can lead to a shift in momentum.
During this window, the market often tries to “test” the highs or lows set in the morning. If the market was trending up all morning, the afternoon session will determine if that trend is sustainable or if “profit-taking” will pull prices back down.
The Power Hour: The Final Countdown
Time: 3:00 PM – 4:00 PM ET
The final hour of the trading day is affectionately (and sometimes terrifyingly) known as the Power Hour. This is when the highest volume of the day typically occurs, rivaling only the opening bell.
What Drives the Power Hour?
-
Fund Rebalancing: Mutual funds and ETFs often need to adjust their holdings to match their benchmarks before the day ends.
-
Day Trader Exit: Day traders, who do not want to hold positions overnight, must close their trades. This creates a flurry of activity.
-
Institutional Finalizing: Large banks and hedge funds finalize their positions for the day.
The last 10 minutes (3:50 PM – 4:00 PM) are particularly intense as “market-on-close” (MOC) orders are matched. This is often where the “Closing Print”—the final official price of the day—is determined.
The Closing Bell and After-Hours Trading
Time: 4:00 PM – 8:00 PM ET
When the bell rings at 4:00 PM, regular trading ends, but the market doesn’t stop. The After-Hours Session begins immediately.
Earnings Season and “The Surprise”
Most publicly traded companies wait until after the closing bell to release their quarterly earnings reports. This is to prevent the “Opening Bell” chaos from being even more extreme. Between 4:01 PM and 4:30 PM ET, you will often see stocks jump or crash by 10% or more in seconds based on these reports.
Like the pre-market, the after-hours session has low liquidity and high volatility. It is a place where professional news-traders react to the latest headlines.
Technical Mechanics: How Trades Actually Happen
To understand the day, you must understand the underlying mechanics that govern every second of the clock.
The Bid-Ask Spread
Every stock has two prices at all times:
-
The Bid: The highest price a buyer is willing to pay.
-
The Ask: The lowest price a seller is willing to accept.
The difference between these two is the Spread. In a liquid market like the S&P 500, the spread might be only a penny. In a “thin” market or during the pre-market, the spread might be dollars wide.
Market Makers vs. Algorithms
In the modern era, the majority of the “volume” you see is not humans clicking buttons; it is Algorithmic Trading. High-frequency computers scan the market for tiny price discrepancies and execute thousands of trades per second. Market Makers are firms that provide liquidity by always being ready to buy or sell, ensuring that when you want to buy a share of a stock, there is someone there to sell it to you.
Common Order Types Used Throughout the Day
Knowing when to trade is as important as knowing how to trade. Here are the tools investors use:
-
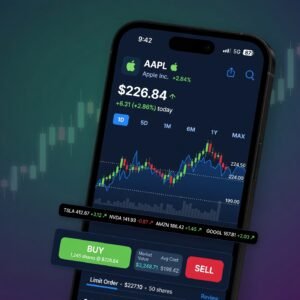
Market Order: An order to buy or sell immediately at the best available current price. (Commonly used in the Morning/Afternoon sessions).
-
Limit Order: An order to buy or sell only at a specific price or better. (Essential for the volatile Pre-market or Power Hour).
-
Stop-Loss Order: An automated order to sell if a stock drops to a certain price, protecting the investor from “the big crash.”
| Order Type | Best For… | Primary Risk |
| Market | Speed / Immediate execution | Paying a higher price than expected |
| Limit | Price control / Precision | The order may never be filled |
| Stop | Risk management / Protection | “Gapping” past your price in a crash |
Market Volatility and Circuit Breakers: The Safety Nets
Sometimes, the trading day gets too intense. If the market (specifically the S&P 500) drops too quickly, “Circuit Breakers” are triggered to prevent a total flash crash.
-
Level 1: A 7% drop triggers a 15-minute halt.
-
Level 2: A 13% drop triggers another 15-minute halt.
-
Level 3: A 20% drop shuts the market down for the remainder of the day.
These pauses give human traders and algorithms time to “breathe,” analyze the data, and stop the emotional panic selling.
How News and Economic Data Shape the Daily Rhythm

The trading day is often interrupted by “Economic Releases.” At 8:30 AM (Pre-market) or 10:00 AM (Morning Session), the government may release data on Inflation (CPI), Employment, or Consumer Confidence.
When these numbers come out, the “rhythm” of the day is temporarily shattered. You will see a “spike” in volume and price as the market incorporates this new information into the current stock prices.
Mastering the Clock
The stock market is a marathon, not a sprint, but that marathon is run in daily laps. By understanding the specific “phases” of a trading day, you can remove the mystery and fear from your investment strategy.
For most laypeople, the best strategy is to ignore the “noise” of the Opening Bell and the Power Hour. Long-term wealth is built by understanding that while the daily rhythm is fascinating, the true power of the market lies in the months and years of growth that follow these daily cycles.
Master the clock, understand the sessions, and you will find that the stock market is not a chaotic casino—it is a finely tuned machine of global commerce.