What is trading volume and why does it matter?

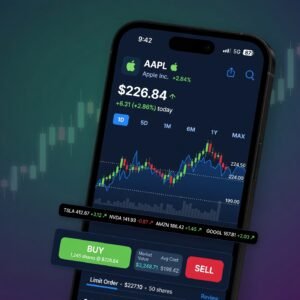
In the world of investing, price is king. Most beginners spend 90% of their time staring at stock prices, watching the green and red numbers fluctuate throughout the day. However, if price is the king, then Trading Volume is the power behind the throne.
Experienced traders often say that price shows you where the market is going, but volume shows you how it is getting there. Without volume, price is just a number. With volume, it becomes a story about supply, demand, and the collective conviction of millions of people.
In this comprehensive guide, we will break down what trading volume is, why it is the most honest indicator in the financial world, and how you can use it to protect your portfolio and spot the next big market move.
What Exactly is Trading Volume? A Simple Breakdown for Beginners
At its most basic level, Trading Volume is the total number of shares (for stocks) or contracts (for options and futures) that changed hands during a specific period.
Every trade requires two parties: a buyer and a seller. If one person buys 100 shares of Apple from another person who sold 100 shares, the volume for that transaction is 100. It is not 200 (adding the buy and the sell); it is a measure of the single exchange of ownership.
Units vs. Dollars
While most charts show volume in “shares,” you will also hear the term Dollar Volume. This is the number of shares traded multiplied by the price of the stock. For institutional investors, dollar volume is often more important because it tells them if there is enough “room” for them to move millions of dollars in or out of a position without causing a massive price spike.
Why Trading Volume is the ‘Secret Sauce’ for Successful Investors
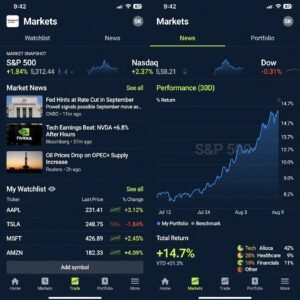
Why does every professional trading platform include volume bars at the bottom of the screen? Because volume measures Conviction. It tells you how much “effort” is being put into a price move.
1. It Confirms the Trend
If a stock price is rising and the volume is also rising, it means there is widespread agreement that the stock should be more expensive. New buyers are constantly entering the market, fueling the move. This is a “healthy” trend.
However, if the price is rising but the volume is falling, it’s a warning sign. It suggests that buyers are disappearing, and the price is moving up only because there are very few sellers. This is often called a “low-volume rally” and is prone to a sudden collapse.
2. It Highlights Liquidity
Liquidity is the ease with which you can buy or sell an asset without affecting its price. High-volume stocks (like Microsoft or NVIDIA) are highly liquid. You can sell thousands of shares in seconds at the current market price. Low-volume stocks (like many “Penny Stocks”) are illiquid; if you try to sell a large amount, you might have to drop your price significantly just to find a buyer.
Decoding the Relationship Between Price and Volume: The Four Quadrants
To use volume effectively, you must look at it in relation to price movement. This relationship is often broken down into four distinct scenarios:
| Price Movement | Volume Movement | Interpretation |
| Rising | Rising | Strong Bullish: Strong conviction; the trend is likely to continue. |
| Rising | Falling | Weak Bullish: Lack of interest; the rally may be running out of steam. |
| Falling | Rising | Strong Bearish: Panic or heavy selling; the downtrend is strong. |
| Falling | Falling | Weak Bearish: Selling is drying up; the bottom may be near. |
Understanding these four quadrants allows you to ignore the “noise” of daily price fluctuations and focus on the structural health of the market.
Accumulation vs. Distribution: Tracking the ‘Smart Money’
One of the most powerful ways to use volume is to identify where the “Smart Money” (banks, hedge funds, and pension funds) is moving. These entities trade in such massive quantities that they cannot hide their tracks—they leave a trail in the volume bars.
Accumulation
This happens when institutional investors are quietly buying up shares of a stock. You will often see the price moving sideways in a narrow range, but the volume bars will show steady, above-average activity. This “quiet buying” is the foundation of the next major breakout.
Distribution
This is the opposite of accumulation. It occurs when big players are selling their shares to the public. The price might still be near all-time highs, but the volume is exceptionally high on “down days” and low on “up days.” This suggests that the big players are exiting while retail investors are still buying the “hype.”
Using Volume to Spot Trend Reversals and ‘Climax’ Events
Volume is an incredible tool for spotting the end of a move. In the world of technical analysis, this is often referred to as Blow-off Tops or Exhaustion Gaps.
The Buying Climax
Imagine a stock that has been rising for months. Suddenly, it shoots up 10% in a single day on the highest volume the stock has seen in years. While this looks “bullish” to a beginner, to a pro, it looks like a Buying Climax. Everyone who wanted to buy has finally jumped in. With no buyers left to push the price higher, the stock often crashes shortly after.
The Selling Climax (The Bottom)
Similarly, when a market is crashing, there is often a day of “extreme panic” where the volume spikes to massive levels as the last “weak hands” sell everything they own. This surge in volume often marks the absolute bottom of a crash because the selling pressure has been completely exhausted.
Popular Volume Indicators: Moving Beyond Simple Bars

While looking at the bars at the bottom of your chart is a great start, there are advanced mathematical tools that help you visualize volume trends over time.
1. On-Balance Volume (OBV)
OBV is a cumulative indicator. If the price closes higher than the day before, that day’s volume is added to the OBV. If it closes lower, the volume is subtracted. If the price is flat but the OBV is rising, it’s a massive signal that buyers are accumulating the stock behind the scenes.
2. VWAP (Volume Weighted Average Price)
VWAP is perhaps the most important tool for day traders. It provides a “true” average price of the day based on both volume and price. If a stock is trading above its VWAP, it is considered bullish for the day. Institutional traders often use VWAP to determine if they are getting a “good deal” on their orders.
3. Volume Profile
Unlike standard volume (which shows volume by time), Volume Profile shows volume by price level. It tells you exactly at what price most people are trading. These “High Volume Nodes” often act as invisible walls of support or resistance.
The Dangers of Low Volume: Why You Should Avoid the ‘Ghost Towns’
Many beginners are attracted to low-priced “Penny Stocks” because they seem like an easy way to get rich. However, these stocks often have incredibly low trading volume.
The dangers of low-volume stocks include:
-
The Bid-Ask Spread: In a high-volume stock, the difference between the buy and sell price is often $0.01. In a low-volume stock, it could be $0.10 or even $0.50. You are “down” on your investment the moment you buy it.
-
Slippage: If you try to sell $10,000 worth of a low-volume stock, your own selling could push the price down by 5% before your order is even finished.
-
Manipulation: Low-volume stocks are much easier for “Pump and Dump” scammers to manipulate because it doesn’t take much money to move the price.
Common Pitfalls: Why Volume Isn’t Always the Whole Truth
While volume is a powerful indicator, it is not perfect. You must be aware of its limitations:
-
Dark Pools: Large institutions often trade in “Dark Pools”—private exchanges that do not report volume in real-time to the public. By the time you see the volume on your chart, the move might already be over.
-
Wash Trading: In the cryptocurrency world especially, some exchanges use bots to trade with themselves to create “fake” volume, making a coin look more popular than it actually is.
-
High-Frequency Trading (HFT): A lot of modern volume is just computers trading with each other for fractions of a second. This “noise” can sometimes make volume look more significant than it really is for a human investor.
Make Volume Part of Your Daily Routine

If you want to move from being a “gambler” to a “systematic investor,” you must start looking at volume. It is the only indicator that tells you what people are actually doing with their money, rather than just what they are saying.
Next time you see a stock price move, don’t just ask “how much?” Ask “on what volume?” If the volume isn’t there, the move probably won’t be either.