What is a stock market index?

Have you ever turned on the news and heard the anchor say, “The Dow is up 200 points today,” or “The S&P 500 hit a new all-time high”? If you are new to the world of finance, these phrases might sound like a secret code. You might wonder: If Apple’s stock went down, why is the ‘market’ up?
The answer lies in the Stock Market Index.
An index is essentially a statistical measure of the changes in a portfolio of stocks representing a portion of the overall market. Think of it as a “thermometer” for the economy. Just as a thermometer doesn’t measure every molecule of air to give you the temperature, an index doesn’t track every single company to tell you how the market is performing. Instead, it looks at a specific group to provide a snapshot of financial health.
In this deep dive, we will explore what indices are, how they are calculated, why they are the backbone of modern investing, and how you can use them to grow your wealth.
What is a Stock Market Index and How Does It Work?

At its core, a stock market index is a mathematical construct. Since there are thousands of companies traded on public exchanges, it would be impossible for an investor to track every single one to understand the “market’s” direction.
An index solves this by selecting a “basket” of stocks. The performance of these stocks is then combined to create a single number. When the stocks in that basket go up in value on average, the index goes up. When they fall, the index falls.
The Methodology: How Stocks Get “Weighted”
Not all indices are created equal. The way an index is calculated determines which companies have the most “power” over the final number. There are two primary methods:
-
Market Capitalization-Weighted (Cap-Weighted): This is the most common method (used by the S&P 500). In this system, larger companies have a bigger impact. For example, a 1% move in Microsoft (a multi-trillion dollar company) will move the index much more than a 1% move in a smaller clothing retailer.
-
Price-Weighted: This is the “old school” method (used by the Dow Jones Industrial Average). Here, the stock price determines the weight. A stock trading at $200 per share has more influence than one trading at $50, regardless of the actual size of the company.
Why Investors and Economists Rely on Indices
Indices aren’t just for fancy charts on Wall Street; they serve vital functions for everyone from government officials to casual savers.
1. The Ultimate Benchmark
Imagine you picked five stocks to invest in, and they grew by 5% this year. You might feel like a genius! However, if the S&P 500 grew by 20% in that same year, your 5% return is actually quite poor.
Indices act as a benchmark. They allow you to compare your personal investment performance against the broader market to see if your strategy is actually working.
2. A Mirror of Economic Sentiment
Indices often react to news before it hits the “real world.” If an index like the Nasdaq (which is tech-heavy) starts dropping rapidly, it might signal that investors are worried about future interest rates or a slowdown in consumer spending. Because indices represent thousands of collective decisions made by the world’s smartest investors, they are one of the best “leading indicators” of where the economy is headed.
3. Reducing Complexity
For the average person, the stock market is overwhelming. An index simplifies the narrative. Instead of saying “1,400 stocks went up, 1,200 went down, and 400 stayed the same,” we simply say “The market was up 0.5%.” This simplicity allows for easier communication and faster decision-making.
The “Big Three” Indices You Need to Watch
While there are thousands of indices worldwide, three dominate the conversation in the United States and global markets.
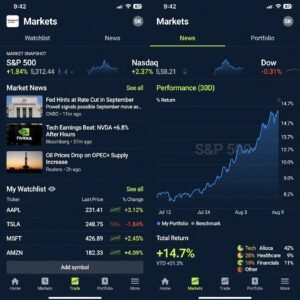
The S&P 500 (Standard & Poor’s 500)
Often considered the “gold standard,” this index tracks 500 of the largest publicly traded companies in the U.S. It covers approximately 80% of the available market value in the U.S. stock market. When someone asks, “How did the market do today?”, they are usually talking about the S&P 500.
The Dow Jones Industrial Average (DJIA)
The “Dow” is the oldest and most famous index. It tracks only 30 massive “Blue Chip” companies like Disney, Coca-Cola, and Goldman Sachs. While it’s famous, many modern investors find it less accurate than the S&P 500 because it only tracks 30 companies and uses the outdated price-weighting system.
The Nasdaq Composite
The Nasdaq is synonymous with technology and innovation. It tracks nearly all the stocks listed on the Nasdaq Stock Market. Because it is heavily weighted toward tech giants (like Apple, Amazon, and Meta), it is the primary indicator for the “Growth” and “Tech” sectors.
Beyond the Basics: Sector and Global Indices

The world of indices goes much deeper than just the Big Three. To get a granular view of the world, investors use specialized indices:
-
Sector Indices: These track specific industries. For example, the Financial Select Sector Index only tracks banks and insurance companies. If you think healthcare is going to boom, you might watch a healthcare index.
-
International Indices: To see how the rest of the world is doing, investors look at the MSCI EAFE (developed markets outside the US/Canada) or the FTSE 100 (the largest companies in the UK).
-
The Russell 2000: This index is crucial because it tracks 2,000 “small-cap” companies. It is often seen as a better indicator of the internal U.S. economy, as smaller companies are more sensitive to domestic issues than global giants.
How to Invest in an Index: Passive vs. Active Strategy
One of the most important things for a beginner to understand is that you cannot buy an index directly. An index is just a list/number. However, you can buy “Index Funds” or ETFs (Exchange-Traded Funds) that perfectly mirror the index.
The Rise of Passive Investing
Passive investing is a strategy where you buy an ETF (like VOO for the S&P 500) and simply hold it. You aren’t trying to “beat” the market; you are trying to be the market.
-
Low Costs: Because a computer manages the fund to match the index, the fees (expense ratios) are incredibly low.
-
Consistency: Over long periods (10-20 years), the vast majority of professional “active” money managers actually fail to beat the S&P 500 index. For most people, “passive” is the more profitable path.
Dividend Indices: Income for the Long Haul
For those looking for cash flow, there are Dividend Aristocrat Indices. These track companies that have not only paid a dividend but increased it every year for at least 25 consecutive years. Investing in an index like this allows you to benefit from both stock price growth and increasing quarterly checks.
Common Misconceptions About Stock Indices
To be a successful investor, you must avoid these common psychological traps regarding indices:
-
“The Index represents the whole economy”: Not true. The stock market index represents large, public corporations. It does not necessarily reflect the health of small businesses, the unemployment rate, or the average household’s wealth.
-
“If the Index is high, it’s too late to buy”: The market spends a significant amount of time at or near “all-time highs” because companies generally grow over time. Waiting for a massive crash that may not come for years is often a losing strategy.
-
“All companies in the index are good”: Indices periodically “kick out” failing companies and add rising ones (this is called rebalancing). An index stays strong precisely because it discards the losers and promotes the winners automatically.
The Index is Your Compass

Navigating the financial world without understanding indices is like sailing a ship without a compass. Whether you want to be a hands-on trader or a “set-it-and-forget-it” investor, the index provides the context you need to make smart decisions.
By focusing on indices rather than individual “hot” stock tips, you diversify your risk, lower your costs, and align your wealth with the long-term growth of the global economy.